X-ALM is pronounced "Cross ALM". It consists of a calculation engine, an analysis tool and a control interface. Each one reads what the previous one wrote.
The engine itself. It reads the configuration and the input data, projects every contract, applies behavioural models and new business, then writes one result file per entity and per scenario. It also runs unattended, in batch mode, for overnight production.
It calculates nothing: it starts from the step-1 results, aggregates them along your reporting dimensions and generates a ready-to-open Power BI project, with its pages, its measures and its semantic model. A few minutes.
An interface in your browser that composes the configuration, checks the input files, launches the two executables and follows their progress. It is not mandatory, but it is where you start.
Microsoft's free software opens the generated project. This is where you explore the figures, page by page: summary, EVE forecast, product drill-down, data table.
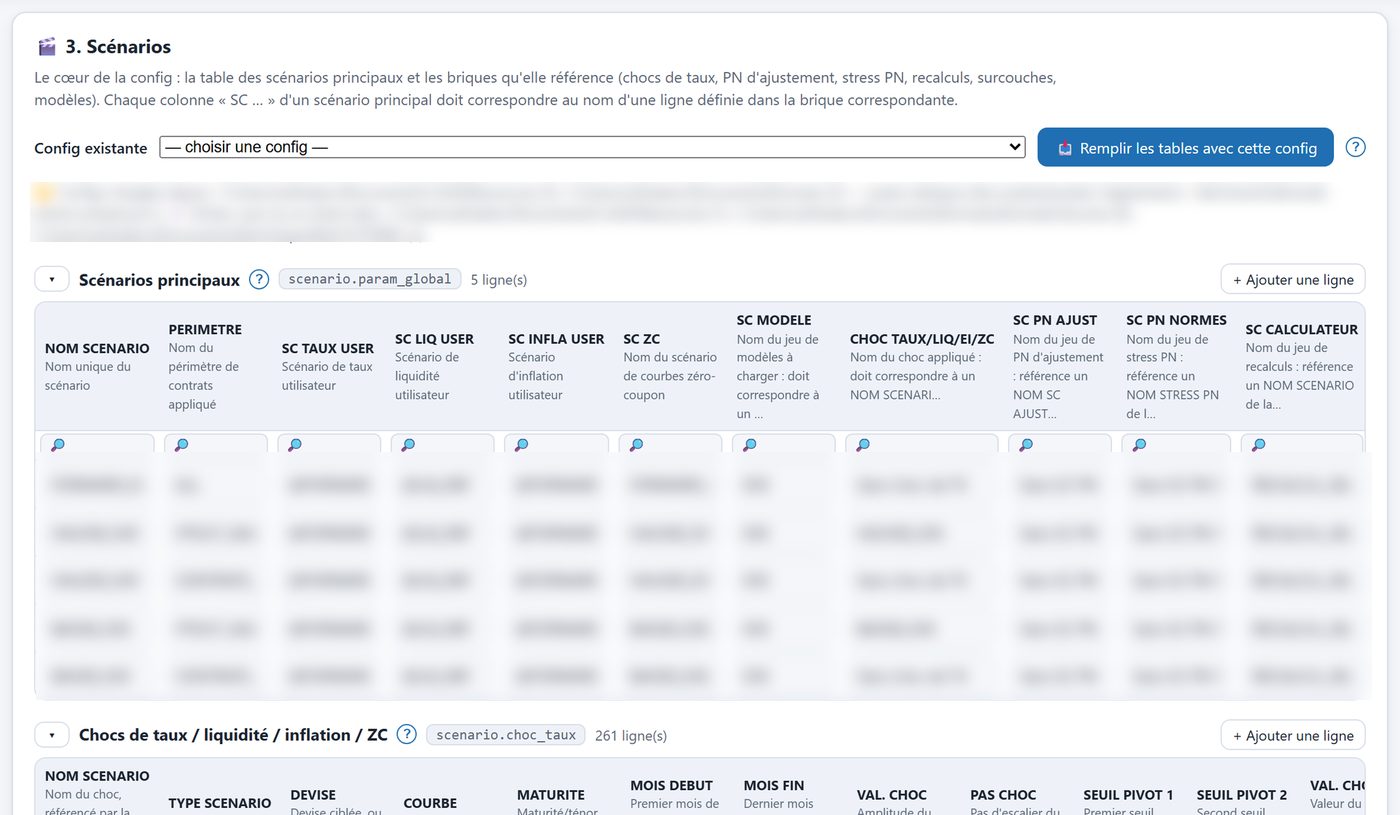
A configuration describes what is projected, at which date, in which scenarios and with which outputs. Xalm.Web composes it page by page and saves it as a readable file, which the engine reads back as is.
The engine reads all its data from a single folder, organised once and for all. It finds the market files for the reporting date by itself.
Five families of files are enough: the market curves at the reporting date, the mapping tables from your reference data, the behavioural model workbooks, the new-business and reporting templates, and the contracts of each entity, one file per product.
Each product is supplied as flat files, one per product and per entity: the contract's characteristics (rate, dates, amounts), its contractual cash flows and its step schedule, if any. The description of each column ships with the software.
A run can cover several entities, each with its own contracts and new business. Results are reported per entity, then consolidated in Power BI. Contract scopes are defined per scenario.
The sample run from the guide, 2.9 million contracts, three scenarios and three hundred months, runs in 15 minutes on an idle laptop. A subset run on a product of some 2,000 contracts takes 24 s; the analysis and the generation of the Power BI project, 1 min 21 s.
The engine builds the interest-rate, liquidity and inflation curves at the reporting date, derives the calculated curves you need from them, and applies up, down, flattening and steepening shocks to them, month by month. A scenario assembles its shocks, its models and its new business by name; a run chains as many as needed on the same book of contracts.
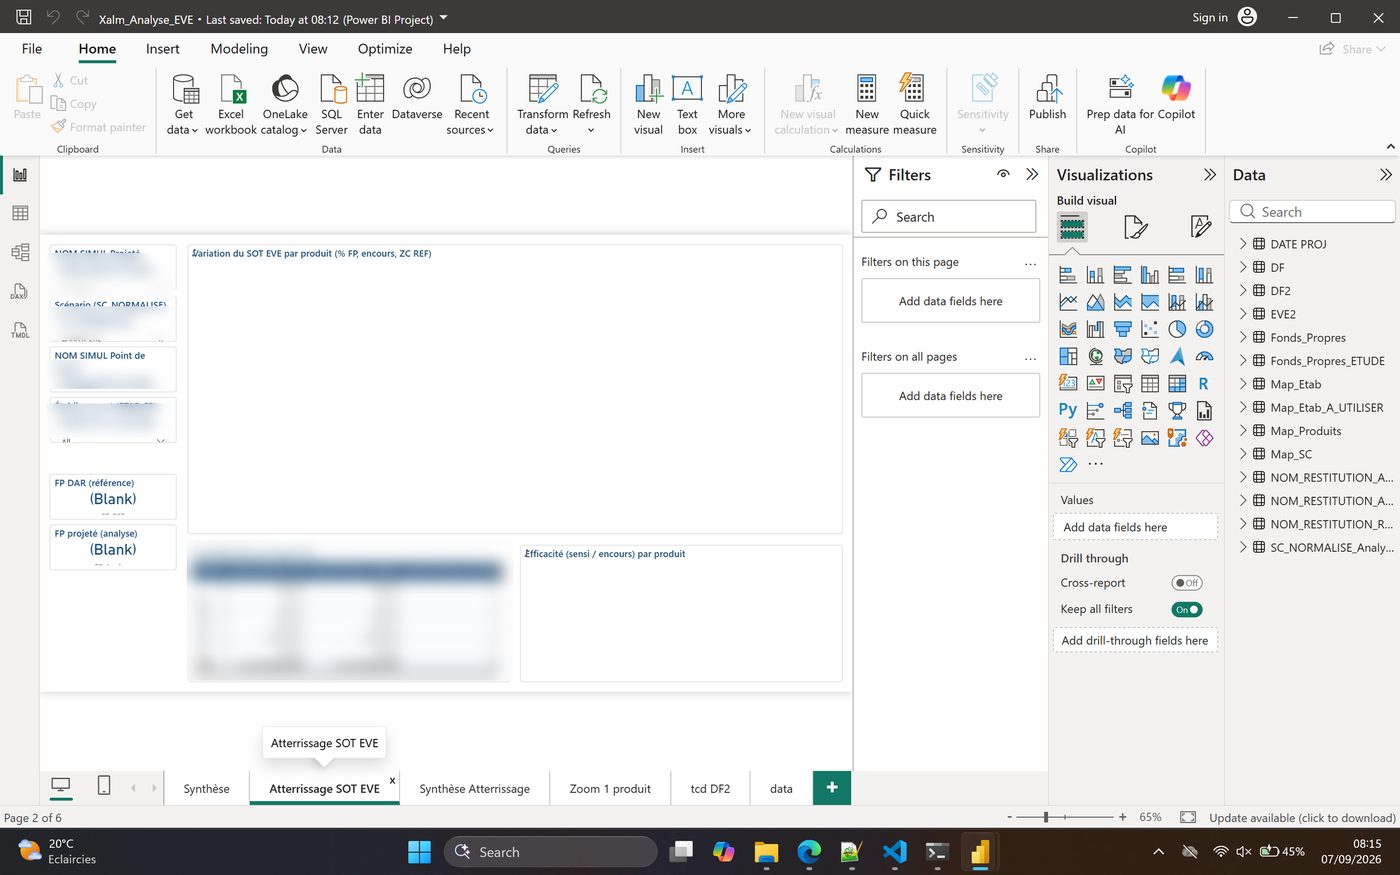
Reporting is configurable: category (existing book or new business), indicator, projection mode (monthly value, forward view per window, annual contribution), windows and sampling step, scopes. The result is a set of reporting files per entity, which Xalm.PowerBI turns into a complete Power BI project.
The generated semantic model contains the mapping tables (entities, products, scenarios) and ready-to-use measures. The report can then be customised like any Power BI report, and republished to your Power BI workspace if you have one.
Xalm.Web also offers a viewer for the reporting files: filters by dimension, sums, aggregation by period and chart per scenario, to check the figures without leaving the browser.
To understand a figure, you must be able to reproduce it. The subset run launches the engine on a single product and a single entity, with the same checks and the same monitoring as a full run, and snapshots its intermediate results: indicators contract by contract, calculation quantities, curves used.
It is the tool for acceptance testing, audit and diagnosis: you isolate a product, compare with your current tool, explain the differences.
Every run creates a time-stamped folder with its configuration, its full log, its time per phase and its results. Nothing is overwritten: two runs can always be compared.
| Item | Required | Note |
|---|---|---|
| Operating system | Windows 10 or 11, 64-bit | x64 or ARM64 build |
| Memory | depends on how much data you have; above 8 million contracts, 32 GB recommended, 64 GB comfortable | The sample run (2.9M contracts, three scenarios) used 33 GB on an idle workstation, 40 GB on a saturated one |
| Disk | Several tens of GB free | A result file is about 675 MB per entity and per scenario |
| Browser | Recent Edge, Chrome or Firefox | For Xalm.Web |
| Power BI Desktop | 2024 edition or later | Free, Microsoft Store |
X-ALM makes no outbound connections. The engine, the interface and the analysis run on the workstation. Your contracts never leave your network.
The user guide walks you through the first run step by step, with the software's actual screens.
 X-ALM Cross ALM