X-ALM turns a bank's contracts at a reporting date into balances, cash flows and interest-rate and liquidity risk indicators, month by month, in every one of your scenarios.
A whole bank, 2.9 million contracts and three scenarios, in a quarter of an hour on a laptop. No server, no database, no installer: the software is copied onto a Windows workstation and runs entirely locally.
Its loans are sound, its customers loyal, its margin comfortable. What threatens it is invisible: the maturity mismatch between what it promises its depositors and what it has lent to its borrowers. The day rates move or confidence goes, that mismatch has to be paid for.
That is what asset and liability management, ALM, is about (what is ALM?). Measuring the mismatch means knowing, for every contract, what it will become in six months, two years, ten years. How much of the loan signed yesterday will be left if its borrower prepays? What is a sight deposit with no maturity worth? What happens to the margin if the curve rises by a hundred basis points? X-ALM answers these questions across the whole balance sheet, starting from the smallest object there is: one contract, followed month after month.
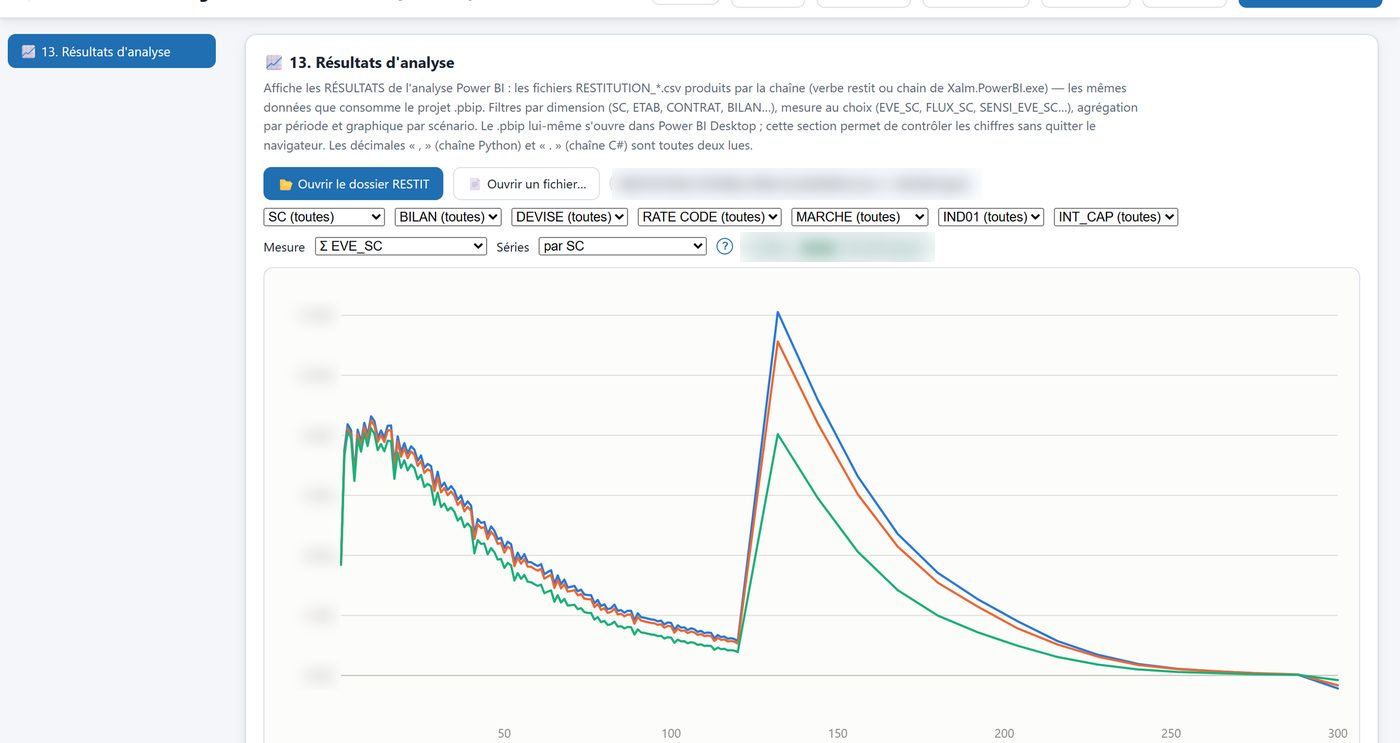
A bank lends long at fixed rates and funds itself short. Move the rate shock and the average life of its assets: the margin reacts immediately on the liability side, and only slowly on the asset side.
This mechanism, maturity transformation, is what X-ALM measures for real: contract by contract, with the actual repayment schedules, prepayments, deposit run-off and new business, over three hundred months and in every scenario.
Educational two-parameter illustration on a €10bn balance sheet, 150 bp baseline margin, liabilities refinanced within one year with 70% pass-through of the shock. This is not an X-ALM result.
End-of-month and average-of-month balances, in the liquidity view and in the interest-rate view, for the existing book and for new business. Liquidity, interest-rate, inflation and regulatory gaps, per entity, per product, per scenario.
Projected net interest income, broken down into rate effect and margin effect, annual contributions of each new-business vintage, customer rates and volumes.
Sensitivity of the economic value of equity (EVE) to rate shocks, LCR and NSFR liquidity ratios, market value of caps, floors and swaptions. Everything derives from the same projection: the figures reconcile.
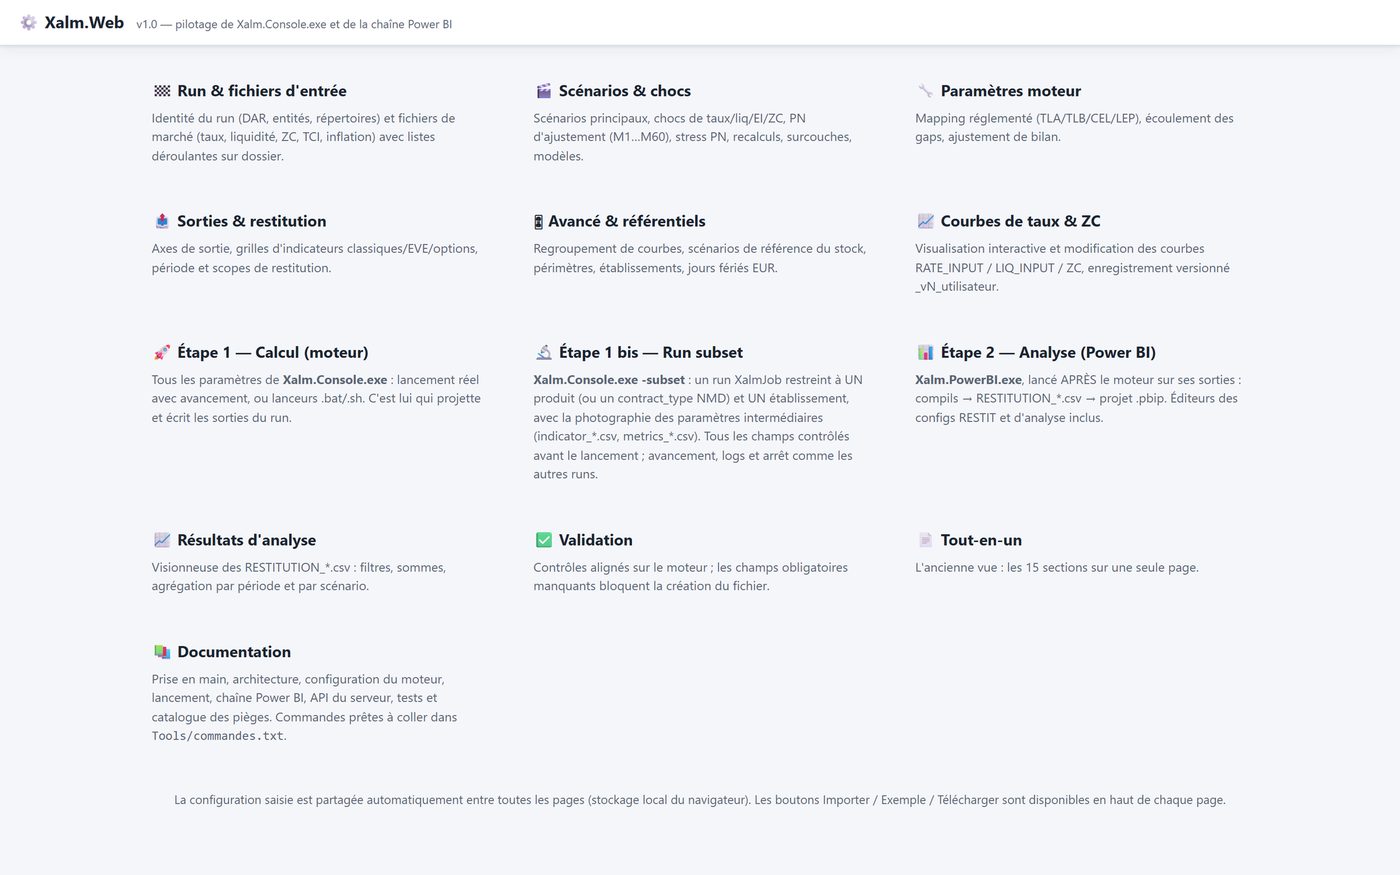
Each step reads what the previous one wrote. The web interface runs the whole chain without leaving the browser.
In Xalm.Web: reporting date, entities, scenarios and shocks, outputs. Input files are checked before launch. Yield curves can be viewed and edited on screen.
The engine projects every contract, applies behavioural models, new business and scenarios, then writes one result file per entity and per scenario.
The analysis tool aggregates the results along your dimensions and generates a complete Power BI project, pages, measures and semantic model included.
Summary, EVE forecast, product drill-down: the report opens in Microsoft's free Power BI Desktop and can be customised like any other report.
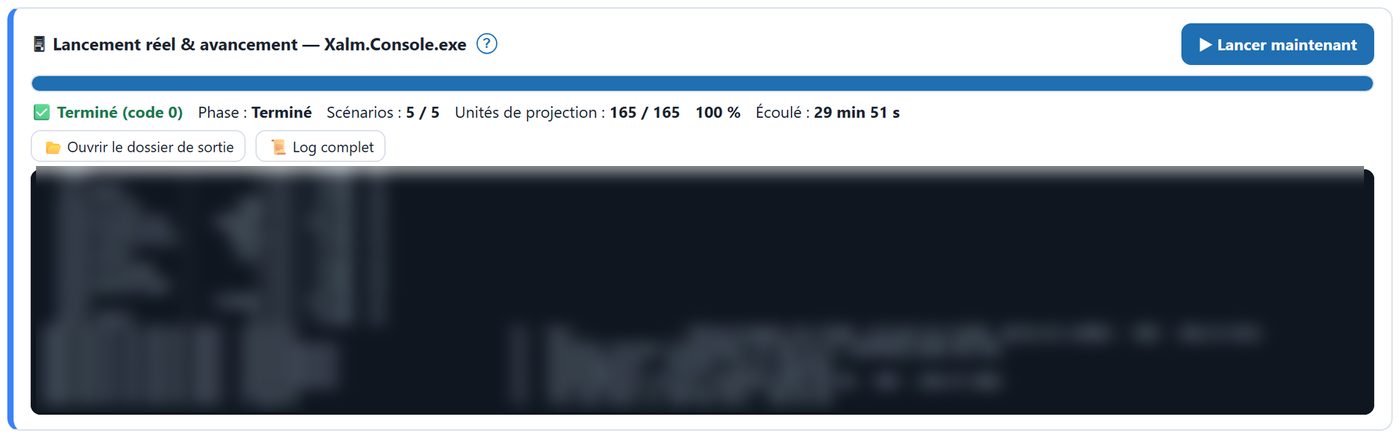
Xalm.Web composes the configuration page by page, checks mandatory fields with the same rules as the engine, detects an outdated executable or a misnamed directory, then launches the calculation and follows its progress live: current phase, scenarios processed, full log.
These are not brochure figures: they are taken from the log of the sample run in the user guide, on a laptop with 64 GB of memory.
These timings were obtained on a laptop, with no server, no database and no dedicated hardware. The engine was designed from the outset for this load, and every version is measured on the same reference run before it ships.
Run time grows roughly in proportion to the number of entities, products and scenarios: a ten-scenario run takes about an hour, not a night.
Measurements from the user guide, table 5: same scope, same engine, three workstation load levels.
An overnight run becomes a coffee-break run. You chain ten scenarios before lunch, replay one product in thirty seconds to understand a deviation, redo the balance sheet after a data fix without waiting for the next day. And all of it on a workstation you already have.
X-ALM reproduces an industry reference model, contract by contract and month by month, with a maximum deviation of the order of 10⁻¹¹. The parity campaigns cover every product family, the existing book as well as new business.
Unit tests and integration tests on anonymised real data, re-run on every change. Every new rule ships with its tests and its frozen reference.
Every product and every indicator is documented: what it is, why it matters for ALM, the data it consumes and the step-by-step algorithm, with formulas and worked examples. An auditor can reproduce the calculation by hand.
Mortgages, equipment loans, personal loans, zero-interest loans, term accounts, interbank loans and borrowings, securities, swaps, repos. Fixed and floating rate, assets and liabilities.
Livret A, LDDS, LEP, CEL, PEL (French regulated savings), passbook accounts, sight deposits, modelled term deposits. Rule-based run-off, stable and volatile portions, inflows, new business.
Caps, floors and swaptions marked to market, with volatility surfaces, shifted Black and Bachelier models.
Constant or rate-sensitive prepayments, renegotiations, PEL closure rates, deferred drawdowns, deposit stability.
A one-hour demo, on our sample data or on an anonymised extract of yours. No commitment.
 X-ALM Cross ALM